
Bivalve Phylogeny
Bivalvia is the second-largest class of mollusks and includes clams, oysters, mussels, and scallops. Over 9,000 species of bivalves have been described, and this group is characterized by an exceptionally rich fossil record.
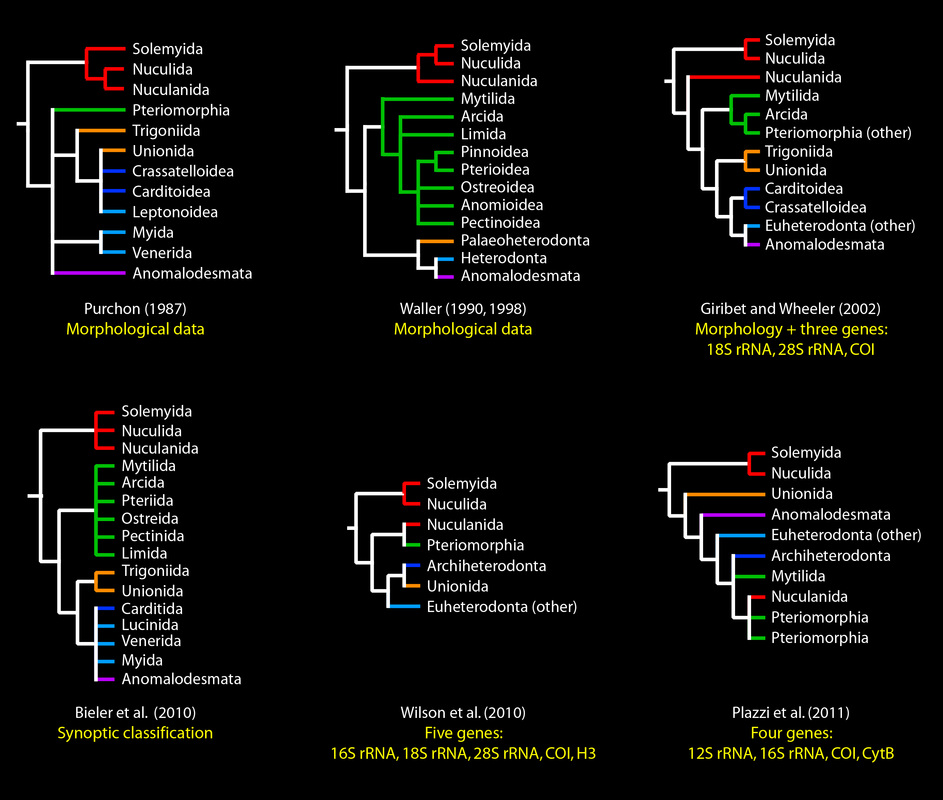
The basal relationships of Bivalvia have long been in dispute. Some alternative hypotheses are depicted below (red: Protobranchia; green: Pteriomorphia; orange: Palaeoheterodonta; purple: Anomalodesmata; indigo: Archiheterodonta; blue: all other Euheterodonta).
The basal relationships of Bivalvia have long been in dispute. Some alternative hypotheses are depicted below (red: Protobranchia; green: Pteriomorphia; orange: Palaeoheterodonta; purple: Anomalodesmata; indigo: Archiheterodonta; blue: all other Euheterodonta).
Sharma et al. (2012) Mol. Phylogenet. Evol. 65: 64-74.
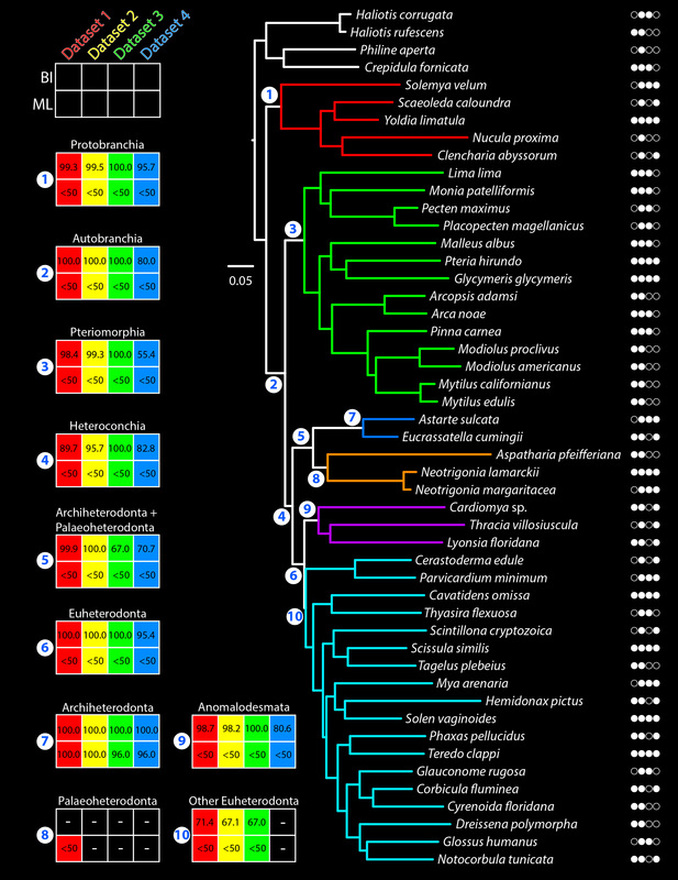
As part of a concerted effort by the Assembling the Bivalve Tree of Life (BivAToL) project to reassess the phylogeny of Bivalvia, we sequenced four conserved housekeeping genes from cDNA libraries for all major lineages of bivalves: ATP synthase beta, elongation factor-1 alpha, myosin heavy chain type II, and RNA polymerase II.
To test for robustness of phylogenetic signal, we analyzed the four-gene dataset in its entirety ("Dataset 1"), without indel-bearing regions ("Dataset 2"), without third codon positions ("Dataset 3"), and without both indel-bearing regions and third codon positions ("Dataset 4").
The figure below summarizes the results of analyzing all four datasets under two optimality criteria, maximum likelihood (ML) and Bayesian inference (BI). The colored plots for 12 nodes of interest indicate recovery of a clade under a particular dataset and optimality criterion. The numbers in the plots indicate posterior probabilities (top row) or bootstrap resampling frequencies (bottom row). The colors in the tree correspond to the major lineages, as in the previous figure above. The circle icons to the right of the terminal names indicate gene sampling for the four genes sequenced (in alphabetical order from left to right; a white entry indicates a sequenced gene).
Sharma et al. (2012) Mol. Phylogenet. Evol. 65: 64-74.
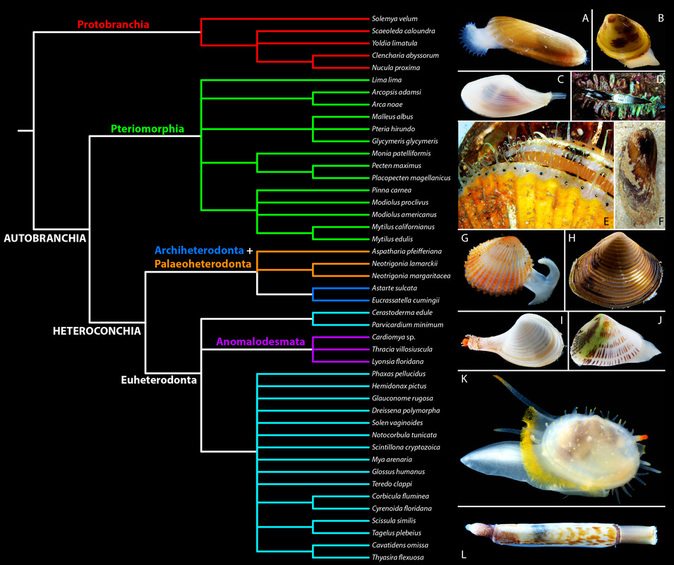
A strict consensus of all eight topologies (below) largely supports the traditional classification of Bivalvia sensu Waller (1990, 1998) and Bieler et al. (2010).
Sharma et al. (2012) Mol. Phylogenet. Evol. 65: 64-74.